
610-459-9646
sales@sciotex.com
ENGINEERING GUIDE
What Is Data Acquisition (DAQ)? The Complete Guide to DAQ Systems
How DAQ systems turn real-world signals into reliable data: the signal chain, the specifications that matter, the main system types, software and how to choose. Written by the engineers who have built custom DAQ systems since 1997.
Last updated October 2026 · Written by Sciotex Engineering · 18 min read
DEFINITION
What is DAQ?
Data acquisition (DAQ) is the process of measuring real-world physical or electrical signals, such as voltage, current, temperature, pressure, strain, vibration or sound, and converting them into digital data that a computer can display, store, analyze and act on.
A DAQ system is the combination of sensors, signal conditioning, an analog-to-digital converter (ADC) and software that performs this conversion.
DAQ is short for data acquisition; you will also see DAS (data acquisition system). The term covers everything from a four-channel USB device on a lab bench to a synchronized, thousand-channel test cell streaming gigabytes per hour.
Whatever the size, every DAQ system answers the same three questions: what am I measuring, how accurately and how fast must I measure it, and what happens to the data once I have it?
HOW IT WORKS
How does a DAQ system work?
Every measurement follows the same path, called the signal chain. A weakness at any stage limits the whole system, so it pays to understand each one.
1. Sense
A sensor or transducer converts a physical quantity into an electrical signal. A Type K thermocouple, for example, produces about 41 µV per °C.
2. Condition
Amplification, filtering, isolation, excitation and linearization turn a tiny, noisy signal into one the ADC can measure accurately.
3. Digitize
The analog-to-digital converter samples the signal at a fixed rate and converts each sample into a number.
4. Transfer
Data moves to a computer or controller over USB, PCIe/PXI, Ethernet or wireless, or is processed directly on an embedded controller or FPGA.
5. Use
Software displays, logs, analyzes and reports the data. In closed-loop systems it also drives outputs that control the process.
COMPONENTS
The components of a data acquisition system
Sensors and transducers
Convert temperature, pressure, force, strain, acceleration, flow, light or sound into a voltage, current, resistance or charge.
Common types: thermocouples, RTDs and thermistors; strain gauges and load cells; pressure transducers; IEPE accelerometers and microphones; LVDTs and encoders; and 4–20 mA process transmitters.
Sensor choice and mounting often matter as much as the DAQ hardware.
Signal conditioning
Raw sensor outputs are rarely ready to digitize. Conditioning includes:
- Amplification for millivolt signals
- Excitation: bridge voltage for strain gauges, constant current for IEPE sensors
- Filtering, including the analog anti-aliasing filter
- Isolation to break ground loops and protect equipment
- Cold-junction compensation for thermocouples
- Shunt resistors for 4–20 mA (250 Ω gives 1–5 V)
Analog-to-digital converter (ADC)
The heart of the hardware. Successive-approximation (SAR) ADCs are fast and suit multiplexed and control applications.
Delta-sigma ADCs offer high resolution, typically 24-bit, with built-in anti-aliasing, which makes them the standard for vibration, acoustics and dynamic measurements.
Digital I/O, counters and outputs
Digital inputs read switches and status signals. Counter/timers read encoders, frequency and pulse trains.
Analog and digital outputs drive valves, setpoints and stimulus waveforms, turning a measurement system into a test or control system.
Timing and synchronization
Sample clocks, triggers and shared timebases keep channels aligned.
Across multiple devices or locations, that means a shared clock, IEEE 1588 PTP, IRIG-B or GPS timing.
Computer, software and storage
Configures the hardware, displays live data, logs to disk or a database, runs analysis and alarms, and hands data to MES, SCADA, LIMS or cloud systems.
In many systems, the software is where most of the engineering effort goes.
Going deeper on how these pieces fit together: DAQ system architectures.
KEY SPECIFICATIONS
DAQ specifications that actually matter
Datasheets list dozens of numbers. These are the ones that decide whether your data can be trusted.
Sampling rate and the Nyquist rule
Sampling rate is how many measurements per second the ADC takes on each channel, in samples per second (S/s). The Nyquist theorem says you must sample at more than twice the highest frequency in the signal, or it will be misrepresented.
In practice, engineers sample at 5–10× the highest frequency of interest to capture the true waveform shape. For frequency-domain analysis alone, about 2.56× is common. Typical starting points:
| Signal | Typical sample rate |
|---|---|
| Temperature (thermocouple, RTD) | 1 – 100 S/s |
| Pressure, flow, process signals | 10 S/s – 1 kS/s |
| Strain (static to quasi-static) | 100 S/s – 10 kS/s |
| Vibration and acoustics | 25.6 – 204.8 kS/s |
| Electrical power and transients | 100 kS/s – several MS/s |
Swipe the table to see all columns →
Aliasing and anti-aliasing filters
If a signal contains frequencies above half the sample rate, they fold back and appear as false lower-frequency signals. This is aliasing, and it cannot be removed after digitizing. Prevent it with an analog low-pass (anti-aliasing) filter before the ADC; delta-sigma DAQ hardware typically builds one in.
Resolution, and what it really buys you
Resolution is the number of bits the ADC uses. The smallest change it can resolve is:
| 16-bit ADC | 24-bit ADC | |
|---|---|---|
| Number of levels | 65,536 | 16,777,216 |
| Step size on a ±10 V range | ≈ 305 µV | ≈ 1.2 µV |
Swipe the table to see all columns →
Worked example: a Type K thermocouple produces roughly 41 µV/°C. On a ±10 V range, a 16-bit ADC’s 305 µV step equals about 7 °C, which is useless. That is why thermocouple modules use small input ranges, high gain and 24-bit converters.
The lesson: resolution only means something relative to the input range, and noise sets the real limit. That is why the effective number of bits (ENOB) is always lower than the nominal bit count.
Accuracy vs. resolution vs. precision
Resolution is the smallest change you can see. Accuracy is how close the reading is to the true value, including offset, gain error, nonlinearity, temperature drift and sensor error. Precision is how repeatable the reading is. A 24-bit system can still be inaccurate, so check the accuracy specification and calibration interval, not just the bit count.
Simultaneous vs. multiplexed sampling
Multiplexed devices share one ADC across channels, so samples are taken one after another with a small time skew between them. That is fine for temperature and slow process signals. Simultaneous-sampling devices have one ADC per channel, so every channel is sampled at the same instant. That is essential for vibration, phase, power and any calculation that combines channels.
Isolation, input range and noise
Isolation protects equipment and breaks ground loops, the single most common cause of noisy industrial measurements. Match the input range and common-mode rating to your signals, and use differential inputs, shielded twisted-pair cable and short sensor leads.
Throughput and data volume
Data adds up quickly. For example, 64 channels × 51.2 kS/s × 4 bytes ≈ 13 MB/s, or about 47 GB per hour.
Size the bus, disk and storage strategy accordingly. Decide early whether you need every raw sample, or whether triggered events, summaries or features calculated at the edge will do.
TYPES
Types of data acquisition systems
DAQ hardware is usually grouped by how it connects and where it lives. Most real systems combine more than one type.
| Type | Best for | Strengths | Trade-offs |
|---|---|---|---|
| USB DAQ devices | Benchtop testing, R&D, portable measurement | Low cost, plug-and-play, laptop-friendly | Limited cable length and channel count; not for harsh environments |
| PCIe / PXI plug-in and chassis | High-speed, high-channel test systems | Highest bandwidth, tight timing and synchronization | Tied to a PC or chassis; higher cost |
| Modular chassis (CompactDAQ-style) | Mixed signals, reconfigurable test stands | Mix-and-match modules, scalable | Vendor ecosystem lock-in |
| Ethernet / distributed DAQ | Plant-wide or long-distance measurement | Long cable runs, nodes close to sensors | Network setup; time synchronization must be designed in |
| Embedded / real-time / FPGA (CompactRIO-style) | Closed-loop control, edge processing, standalone operation | Deterministic, runs without a PC, on-board logic | More engineering effort; specialized programming |
| Standalone data loggers | Long-duration, remote, unattended logging | Battery or DC powered; records to its own memory | Usually slower; limited real-time analysis |
| Wireless DAQ | Rotating, moving or hard-to-wire assets | No cabling | Bandwidth, latency, battery and RF limits |
Swipe the table to see all columns →
For how these combine into modular, distributed and high-performance designs, see DAQ system architectures.
SOFTWARE
DAQ software: ready-to-run vs. custom
Hardware captures the signal; software decides what the data is worth. There are three broad approaches.
Ready-to-run vendor software
Configure channels, view live charts and log to file with no programming.
Best for simple logging and quick lab measurements.
Programming with driver APIs
LabVIEW, Python, C/C#/.NET or MATLAB using vendor drivers such as NI-DAQmx.
Best for automated test sequences, custom analysis and coordinating several instruments.
Custom DAQ applications
Purpose-built software with operator screens, test sequencing, recipes, databases, user roles and audit trails, integrated with PLCs, MES, LIMS or ERP.
Best for production test, regulated environments (e.g. 21 CFR Part 11) and systems many people depend on.
What to decide before you write a line of code
- File format: TDMS, HDF5, CSV or a database
- Real-time processing vs. post-processing
- Who will maintain the code long term
- Validation and documentation requirements
- Licensing and deployment to test stations
- Cybersecurity for networked systems
Sciotex LabVIEW programmers build and modernize DAQ software, including FPGA-based systems. For a detailed comparison, see our article on data acquisition software.
COMPARISONS
DAQ vs. data logger vs. PLC vs. oscilloscope
These overlap, and many systems use several together. The difference is what each is optimized for.
| DAQ system | Data logger | PLC / SCADA | Oscilloscope | |
|---|---|---|---|---|
| Optimized for | Measurement fidelity and analysis | Long-term unattended recording | Deterministic machine control | Viewing fast waveforms |
| Channels | 1 to 1,000+ | A few to dozens | Many I/O, mostly discrete | 2 – 8 |
| Speed | S/s to MS/s | Usually slow (seconds to ms) | Scan cycles in ms | GS/s |
| Analysis | Extensive, customizable | Basic | Minimal | Waveform measurements |
| Typical use | Test, R&D, validation | Field and environmental logging | Running a production line | Debugging electronics |
Swipe the table to see all columns →
A common pattern: the PLC runs the machine, while a DAQ system captures the high-speed, high-accuracy measurements the PLC cannot. The two exchange data over EtherNet/IP, Modbus or OPC UA.
APPLICATIONS
Where DAQ systems are used
Product test and validation
End-of-line and functional test, fixtures, pass/fail limits and traceable results. See ATE systems.
R&D and laboratory research
Multi-channel experiments, stimulus and response, and rapid reconfiguration between test protocols.
Manufacturing and process monitoring
Machine and process variables, fault alarms, SPC and quality data from the production floor.
Life sciences and medical devices
Physiological signals, instrument software and validated test systems for regulated products.
Aerospace, defense and automotive
Structural, environmental, engine and vehicle testing under harsh conditions.
Energy, environment and infrastructure
Power quality, emissions, structural health and long-term remote monitoring.
SELECTION
How to choose a DAQ system: a 10-point checklist
10-point DAQ selection checklist
- Signal types and ranges (V, mA, thermocouple, RTD, strain, IEPE, digital)
- Channel count now, and in 3–5 years
- Sample rate per signal (apply the 5–10× rule)
- Required accuracy, not just resolution
- Simultaneous or multiplexed sampling
- Isolation and the electrical environment
- Physical environment: lab, plant floor, mobile or outdoor
- Where processing happens: PC, real-time controller, FPGA or cloud
- Software, integration and data-management needs
- Validation, documentation and total cost of ownership
When off-the-shelf is enough, and when it isn't
Off-the-shelf DAQ works well when your signals are standard and the software only needs to view and log.
A custom-engineered system pays off when you have unusual sensors, tight timing, many instruments to coordinate, operators who need a simple interface, regulatory requirements, or integration with plant systems.
REAL-WORLD EXAMPLES
Data acquisition systems we have built
Theory is the easy part. These are systems Sciotex engineers designed, programmed and supported.
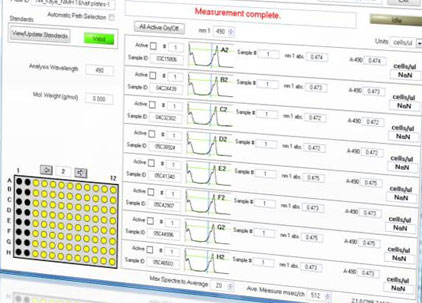
Spectrophotometer & fluorometer software
Multiple versions of the commercial instrument software for the ND-1000, ND-8000 and ND-3300.
View example →
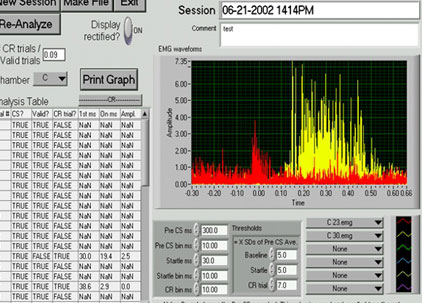
Mouse conditioning tester
Researchers create, save and run time-dependent stimulation recipes and measure physiological responses across multiple subjects.
View example →

Electrotechnology laboratory monitor
Simultaneous monitoring and logging of data from five test stations distributed across a laboratory.
View example →
Stimulus & response system
Applies complex voltage waveforms to biological samples while logging and analyzing tissue response.
View example →
Glove box tester
Automated open/close cycling with force monitoring and high-speed logging of unusual events.
View example →
Injection molding monitor
Logs injection molding machine operation and alerts operators to fault conditions.
View example →
Treadmill monitor
Physiological data from horses, synchronized with treadmill speed and angle of incline.
View example →
Surgical needle bend tester
Automated verification that production batches of surgical needles meet mechanical yield specifications. FDA-validated system.
KEEP LEARNING
DAQ articles
How to Choose the Right Data Acquisition System
Requirements, hardware categories, software and worked configuration examples.
Read article →
DAQ System Architectures
Modular, distributed and high-performance test architectures, and when to use each.
Read article →
LabVIEW: Functionality, Architecture and Applications
How LabVIEW is used to build test, measurement and DAQ software.
Read article →
Data Acquisition Software: Ready-to-Run, LabVIEW, Python or Custom
How to choose between vendor software, LabVIEW, Python and custom DAQ applications.
Read article →
FAQ
Data acquisition FAQs
What does DAQ stand for?
DAQ stands for data acquisition: measuring physical or electrical signals and converting them into digital data for a computer. It is sometimes also written DAS, for data acquisition system.
What is the difference between DAQ and a DAQ system?
DAQ is the process. A DAQ system is the equipment and software that perform it: sensors, signal conditioning, an ADC-based DAQ device and software.
How does a DAQ work?
A sensor converts a physical quantity into an electrical signal. Signal conditioning amplifies and filters it, an analog-to-digital converter samples it at a fixed rate and converts it into numbers, and software displays, stores and analyzes the data.
What sampling rate do I need?
At least twice the highest frequency in your signal (the Nyquist rate), with an anti-aliasing filter in front of the ADC. For accurate time-domain waveforms, sample at 5–10 times the highest frequency of interest.
Is a 16-bit or 24-bit DAQ better?
A 24-bit DAQ resolves much smaller changes, which matters for low-level signals such as thermocouples and strain gauges and for dynamic signals with a wide range. For many higher-level signals, 16-bit is enough. Accuracy and noise matter as much as the bit count.
What is the difference between a DAQ and a data logger?
A data logger is a type of DAQ optimized for long, unattended recording, usually at low speeds. A general DAQ system is optimized for higher speeds, more channels and real-time analysis.
Can a PLC replace a DAQ system?
PLCs are built for control, with scan times in milliseconds and limited analog resolution. For high-speed, high-accuracy or synchronized measurements, a DAQ system is used alongside the PLC.
What software is used for data acquisition?
Vendor ready-to-run software for simple logging; LabVIEW, Python, C# or MATLAB with driver APIs for custom applications; and purpose-built applications for production and regulated environments.
When should I use a custom DAQ system?
When standard hardware and software can’t meet your signal, timing, environment, integration or validation requirements, or when operators need a simple, reliable application rather than an engineering tool.
Need a DAQ system that just works?
Sciotex has designed, programmed and supported custom data acquisition systems since 1997. Our 100% US-based team includes Certified LabVIEW Developers and Architects.

© Copyright 2026 by Coleman Technologies, Inc. DBA Sciotex